As mentioned in my previous post, I've been keeping an eye on my logs after putting this blog live on App Engine. One thing that wasn't so easy to do with App Engine was monitor the datastore calls being made (like I would with Microsoft's SQL Server Profiler).
Luckily for us, Google added some API Hooks into App Engine and with some help from Nick Johnson and Jens Scheffler I managed to cobble together some scripts that allowed me to identify and solve my problems.
Today, by accident, I came across a library that completely blew my hacked scripts out of the water...
Guido van Rossum's Appstats
Guido van Rossum (a Software Engineer at Google, and the author of the Python programming language!) has released a library called Appstats that hooks and monitors the API calls your app makes and presents them in tables and graphs to aid profiling. Setting it up in your app is a breeze (especially if you already use util.run_wsgi_app to run your app).
I got it up and running on my blog via the dev server (though it works equally well on the production servers) to see how well it works. After a few clicks around the app, I navigated to /stats to see what it came up with.
The Appstats Dashboard
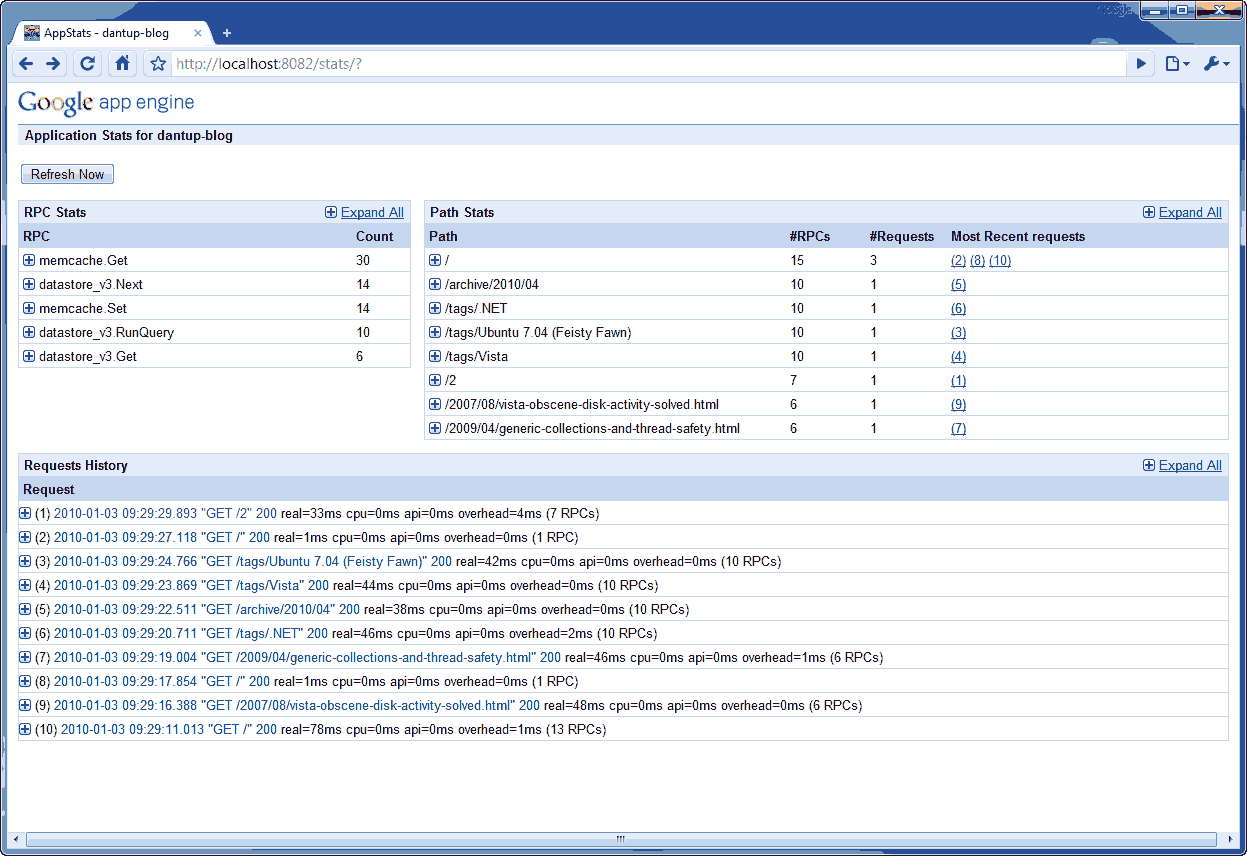
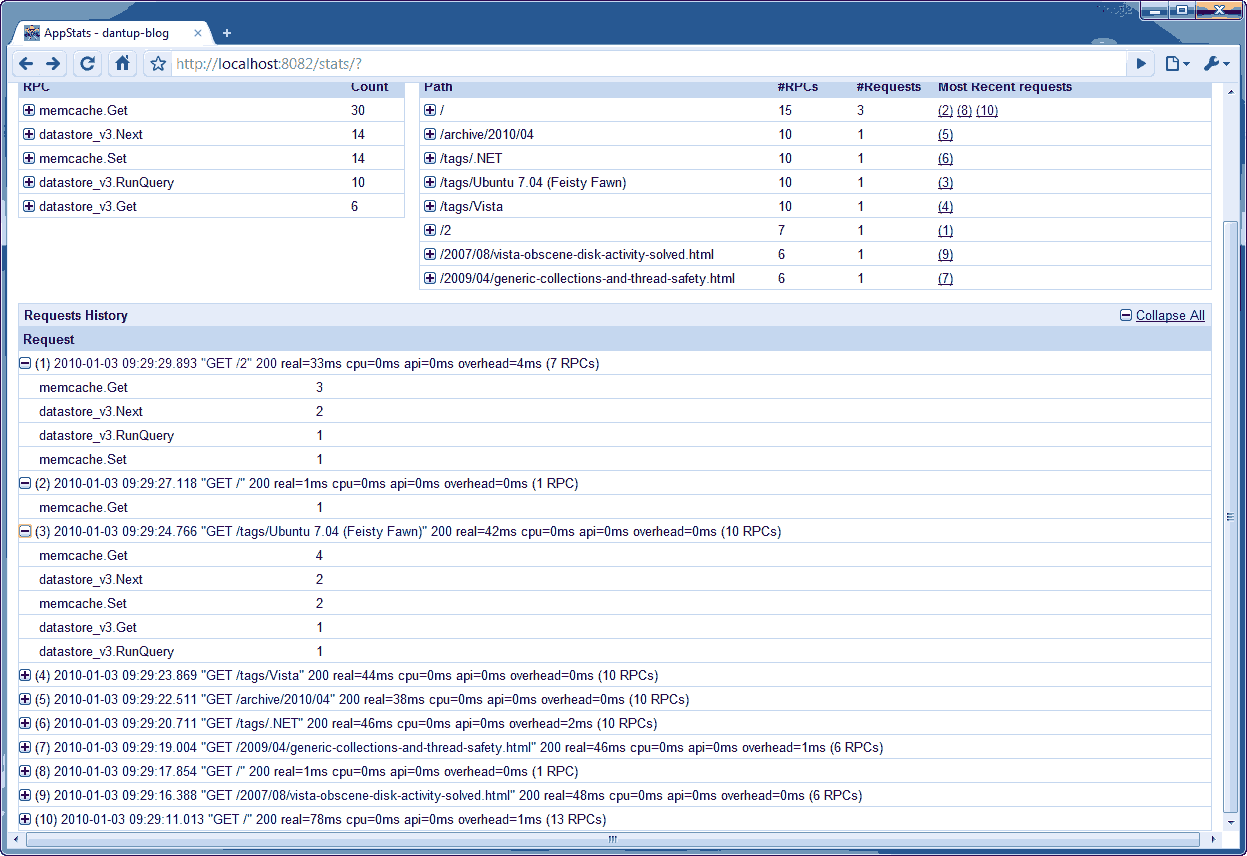
The Appstats dashboard is broken into three sections. The first shows stats for each API method you've called. The second shows stats by URL. The third shows recent requests. Each line in these tables can be expanded for a breakdown of the numbers, as shown below.
Request Statistics
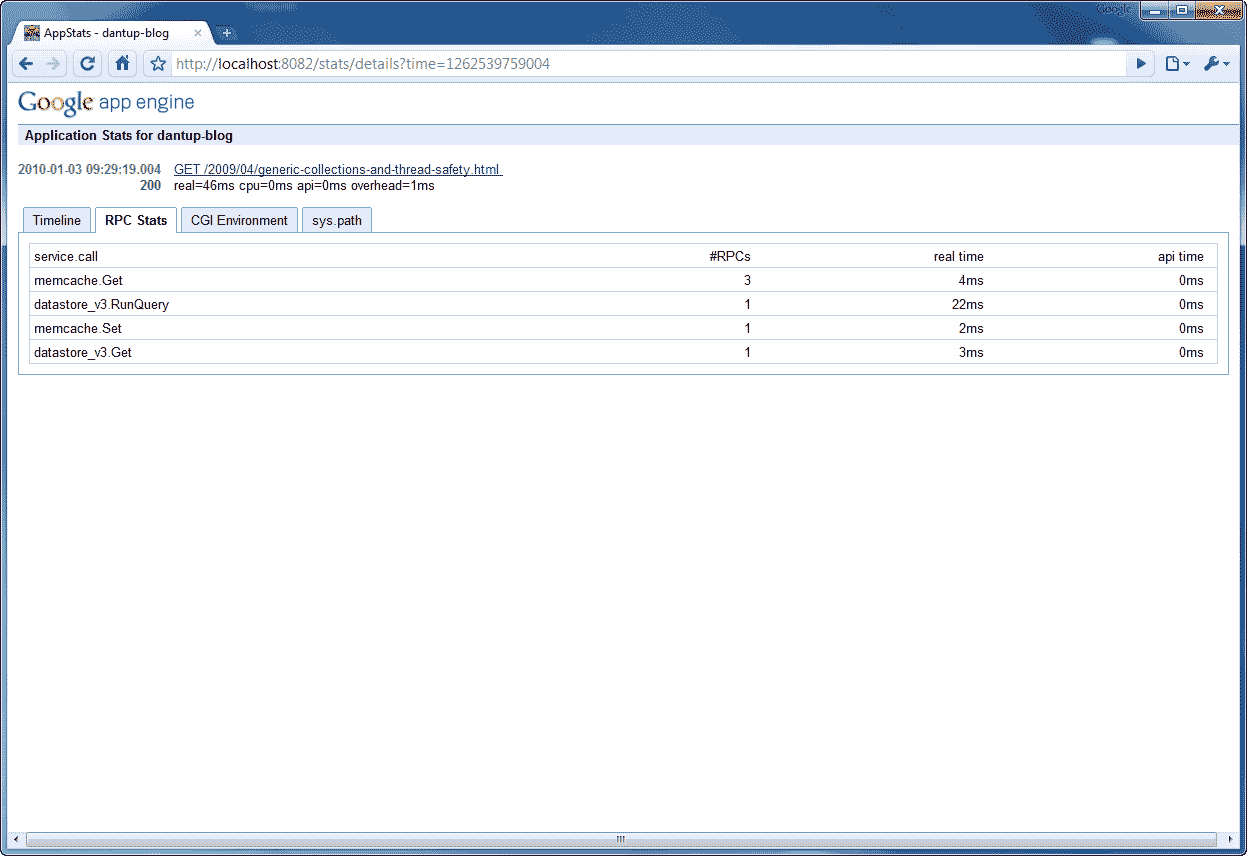
Once you click on a request, you'll get a lot of information about the API calls made.
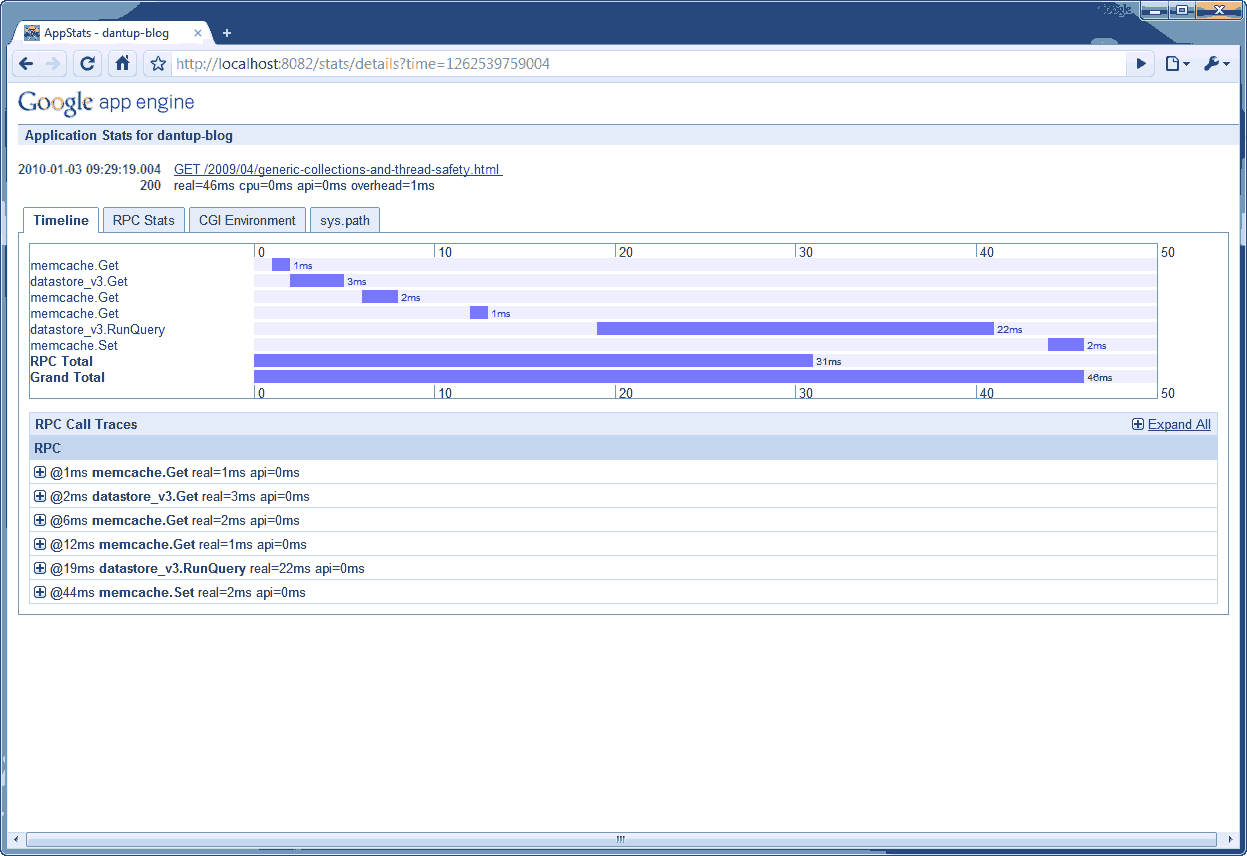
The first thing shown is a timeline showing not only how long each call took, but also when it started and finished (the will help identify large amounts of time being spent outside of the API calls). In the above example you can see that the most expensive part of this request was a RunQuery call. This call fetches comments for a given post when the posts HTML is not in memcache. All other lookups performed are either memcache Gets or db get_by_key_name calls, which are very fast in comparison.
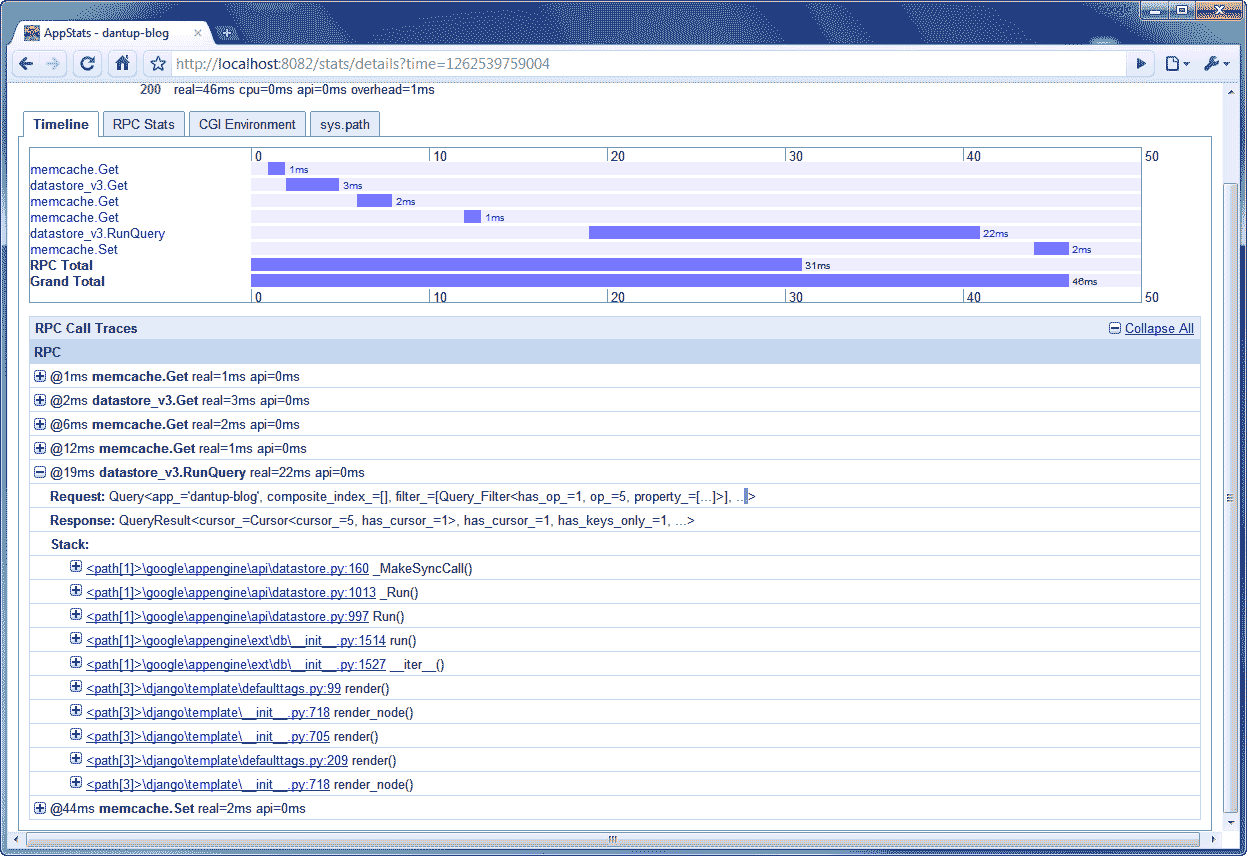
If you expand one of the API calls you'll see a breakdown of what the call involved (both the request and response). You can specify how much text is included in these tables (such as the request/response) by changing the Appstats options.
Finally there's a summary table showing all API calls for the given request, much the same as on the dashboard, though this one includes timings.
Appstats looks to be a very valuable tool for any App Engine developer, and I look forward to seeing what comes out of the team in the future!