
I previously blogged about setting up a Cardano relay using Kubernetes. The IOHK cardano-node container image has built-in support for exposing Prometheus metrics and microk8s has addons for Grafana/Prometheus, so it made sense to use them together.
Posts in this series:
- Step 1: Setting up Cardano Relays using Kubernetes/microk8s
- Step 2: Monitoring Cardano Relays on Kubernetes with Grafana and Prometheus
- Step 3: Using Kubernetes ConfigMaps for Cardano Node Topology Config
- Step 4: Setting up a Cardano Producer node using Kubernetes/microk8s
If you find this post useful or are looking for somewhere to delegate while setting up your own pool, check out my pool [CODER]! 😀
Enabling Grafana and Prometheus
microk8s comes with a number of addons to set up some common services. I installed dashboard (to help me poke around while learning), dns (to allow pods and services to discover each other using hostnames) and prometheus (to scrape metrics from both the Kubernetes nodes and the Cardano pods).
microk8s enable dns
microk8s enable dashboard
microk8s enable prometheus
By default, these services are only exposed within the cluster. In order to be able to access Grafana without having to SSH in and forward a port, I bound it to a NodePort.
I created a file grafana-nodeport.yaml and applied it with microk8s.kubectl apply -f grafana-nodeport.yaml.
apiVersion: v1
kind: Service
metadata:
  name: grafana-nodeport
  namespace: monitoring
spec:
  type: NodePort
  selector:
    app: grafana # The name of the grafana app, pre-configured by the microk8s addons
  ports:
    - port: 3000 # The port grafana is listening on, pre-configured by the microk8s addon
      nodePort: 30500 # The port to expose on the host machine
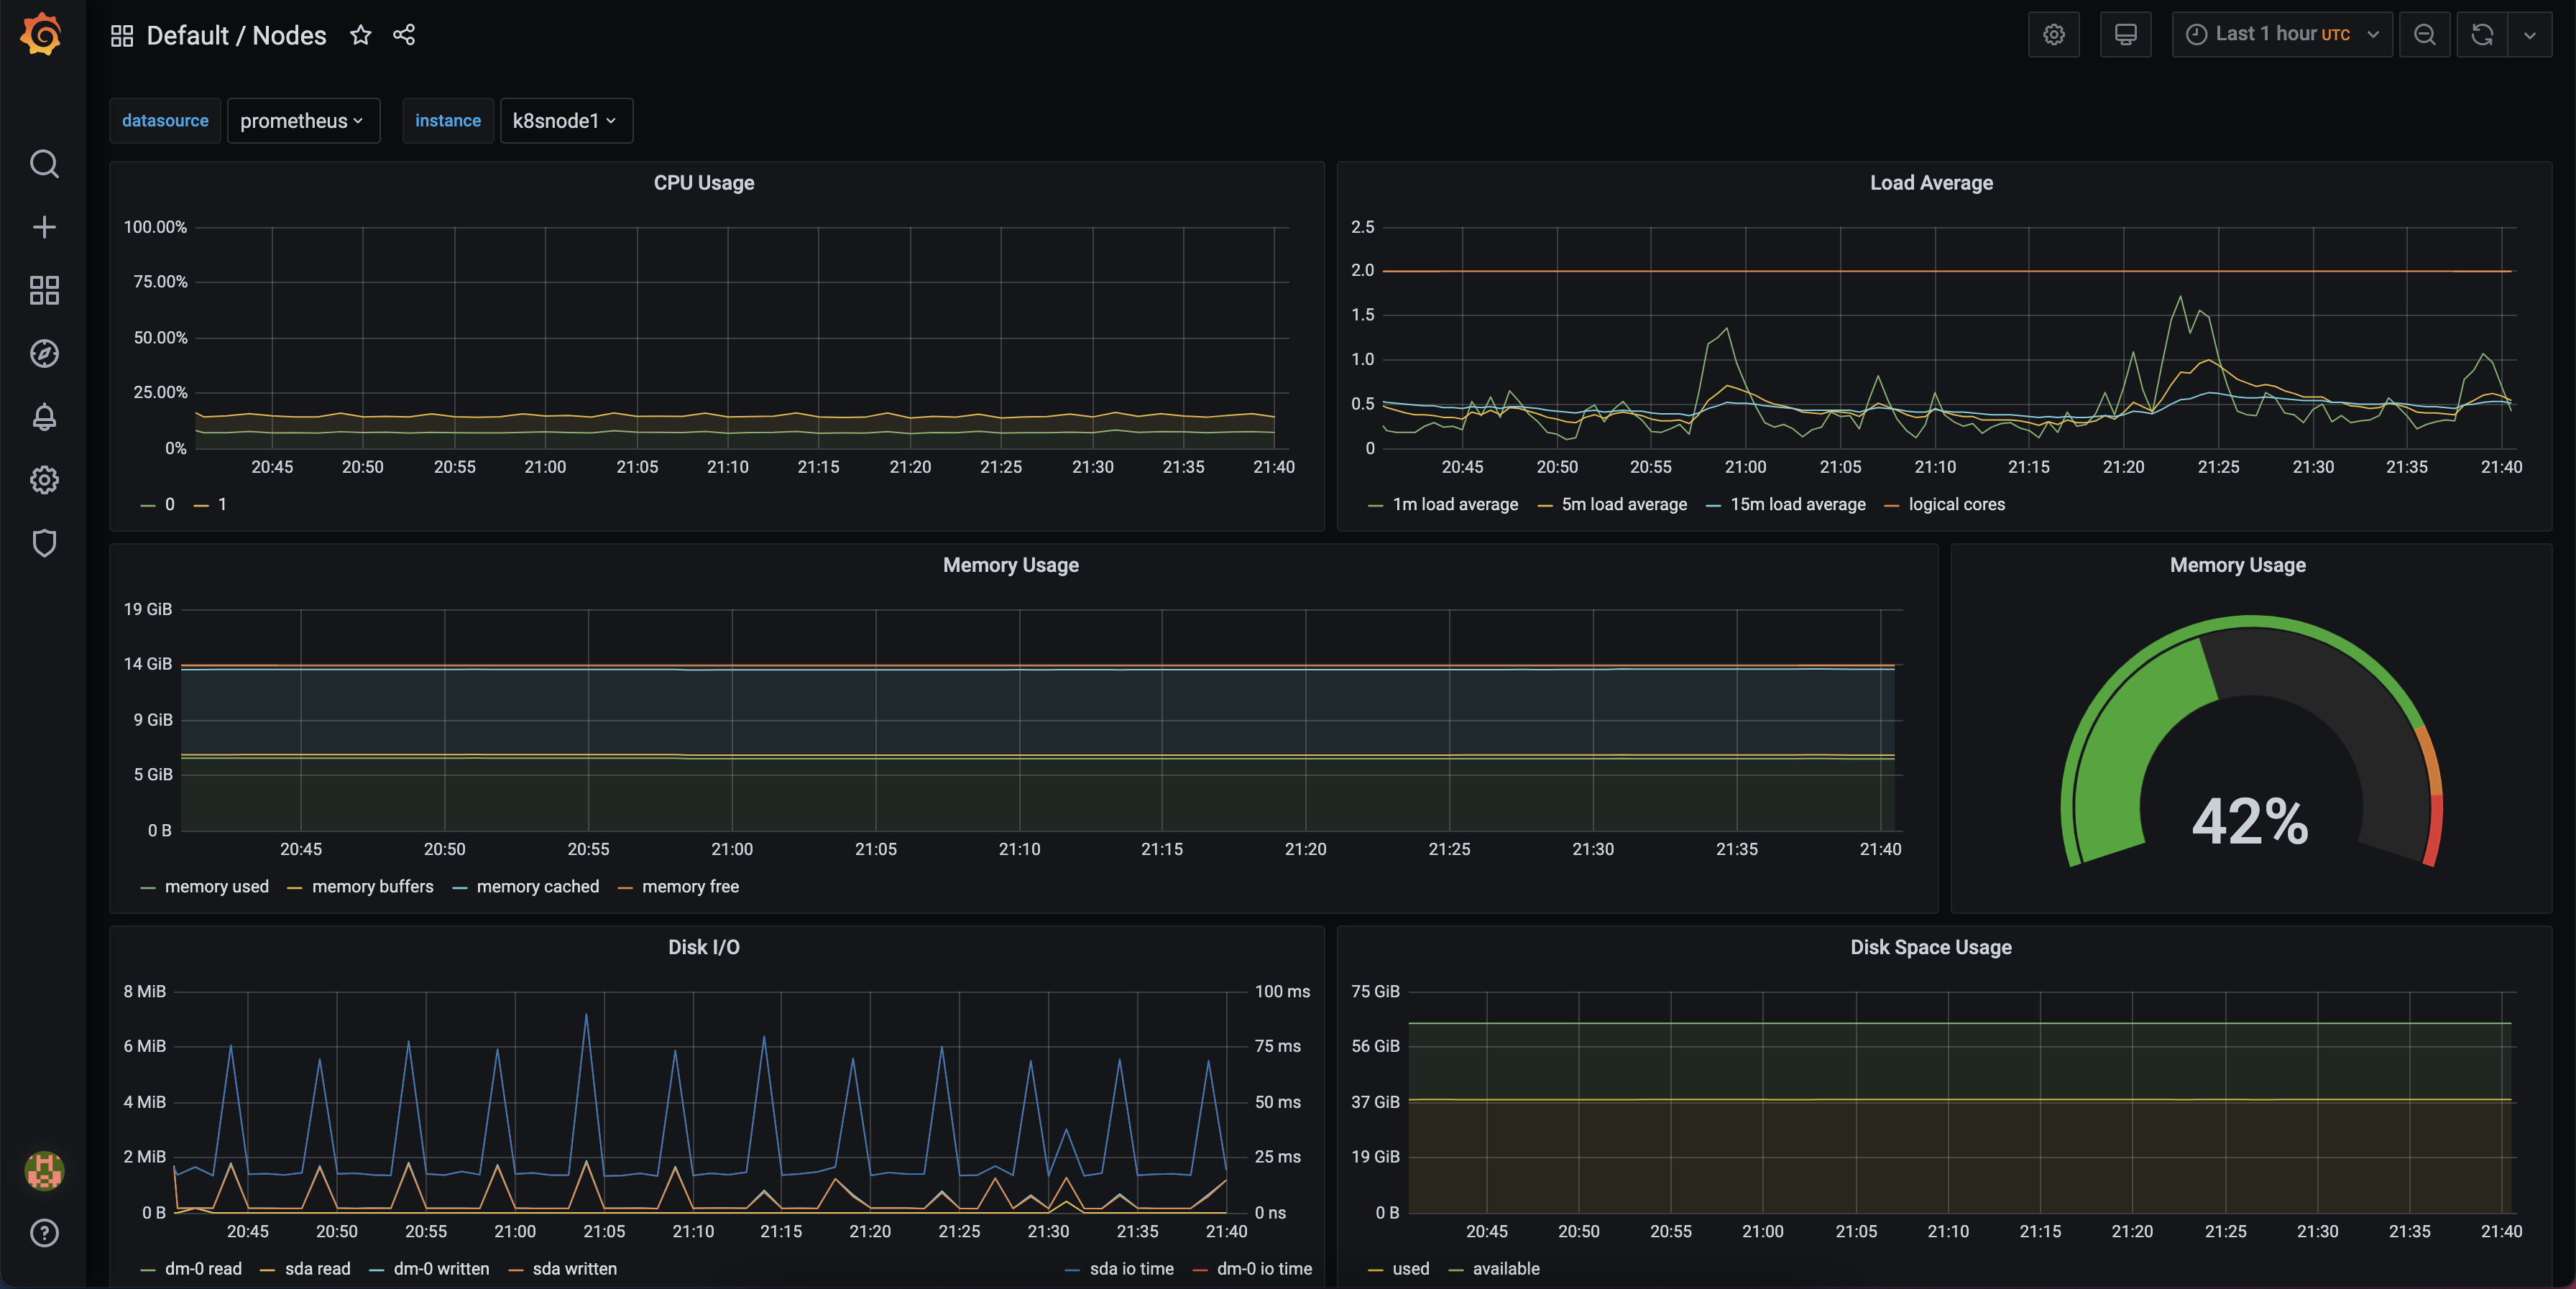
With this done, I hit http://k8snode1:30500/ in the browser on my local machine and was greeted by a Grafana login page. The default username/password was admin/admin (you’re prompted to change the passed upon login) and once logged in I found many preconfigured dashboards for Kubernetes and Prometheus, including Nodes which gave a good overview of the nodes resources:
Updating the Cardano Node Configuration Files
There were a few changes I had to change in the previously-downloaded config files to get the cardano-node metrics into Grafana.
In mainnet-config.json I changed the IP address for hasPrometheus from 127.0.0.1 to 0.0.0.0:
  "hasPrometheus": [
    "0.0.0.0",
    12798
  ],
Without this, I was unable to connect to /metrics from outside the pod/container - a requirement for the Prometheus metrics to be scraped. Doing this allows anyone with access to the container to access these metrics, although in the case of Kubernetes, this only includes other things inside the cluster (unless you expose the port further) so is fine for me.
Additionally, I enabled TraceBlockFetchDecisions:
"TraceBlockFetchDecisions": true,
Without this, the BlockFetchDecision_peers_connectedPeers metric didn’t seem to show up in /metrics, which I wanted to show on Grafana as a check that the nodes were connecting to other peers correctly (although this only includes outgoing peers - I don’t believe there’s currently a way to get inbound peers listed in /metrics).
Setting up the ServiceMonitor
Finally, we need to ensure that the Prometheus instance we’re running is scraping the metrics from the relay. We can do this with a ServiceMonitor. The addons we installed are already running prometheus-operator (in the monitoring namespace) which use ServiceMonitor configurations to know what to scrape. This makes it as simple as defining a ServiceMonitor that points at our service and with a scrape interval.
In order to avoid end up eventually having two ServiceMonitors (one for relays, one for producer) I created a service that includes all of my Cardano nodes (whether relay or producer):
apiVersion: v1
kind: Service
metadata:
  name: cardano-mainnet-node-prometheus-service
  labels:
    app: cardano-mainnet-node-prometheus
spec:
  selector:
    app: cardano-mainnet-node
  ports:
    - name: metrics
      port: 30101
      targetPort: 12798
I then created a ServiceMonitor to monitor this “service” (all pods in the service will be scraped):
apiVersion: monitoring.coreos.com/v1
kind: ServiceMonitor
metadata:
  name: cardano-mainnet-node-monitor
  namespace: monitoring
spec:
  endpoints:
    - interval: 30s
      port: metrics
      path: /metrics
  namespaceSelector:
    matchNames:
      - default
  selector:
    matchLabels:
      app: cardano-mainnet-node-prometheus
A few microk8s.kubectl apply -f’s and a few minutes later, I was able to access metrics from the relay in a new Grafana dashboard:
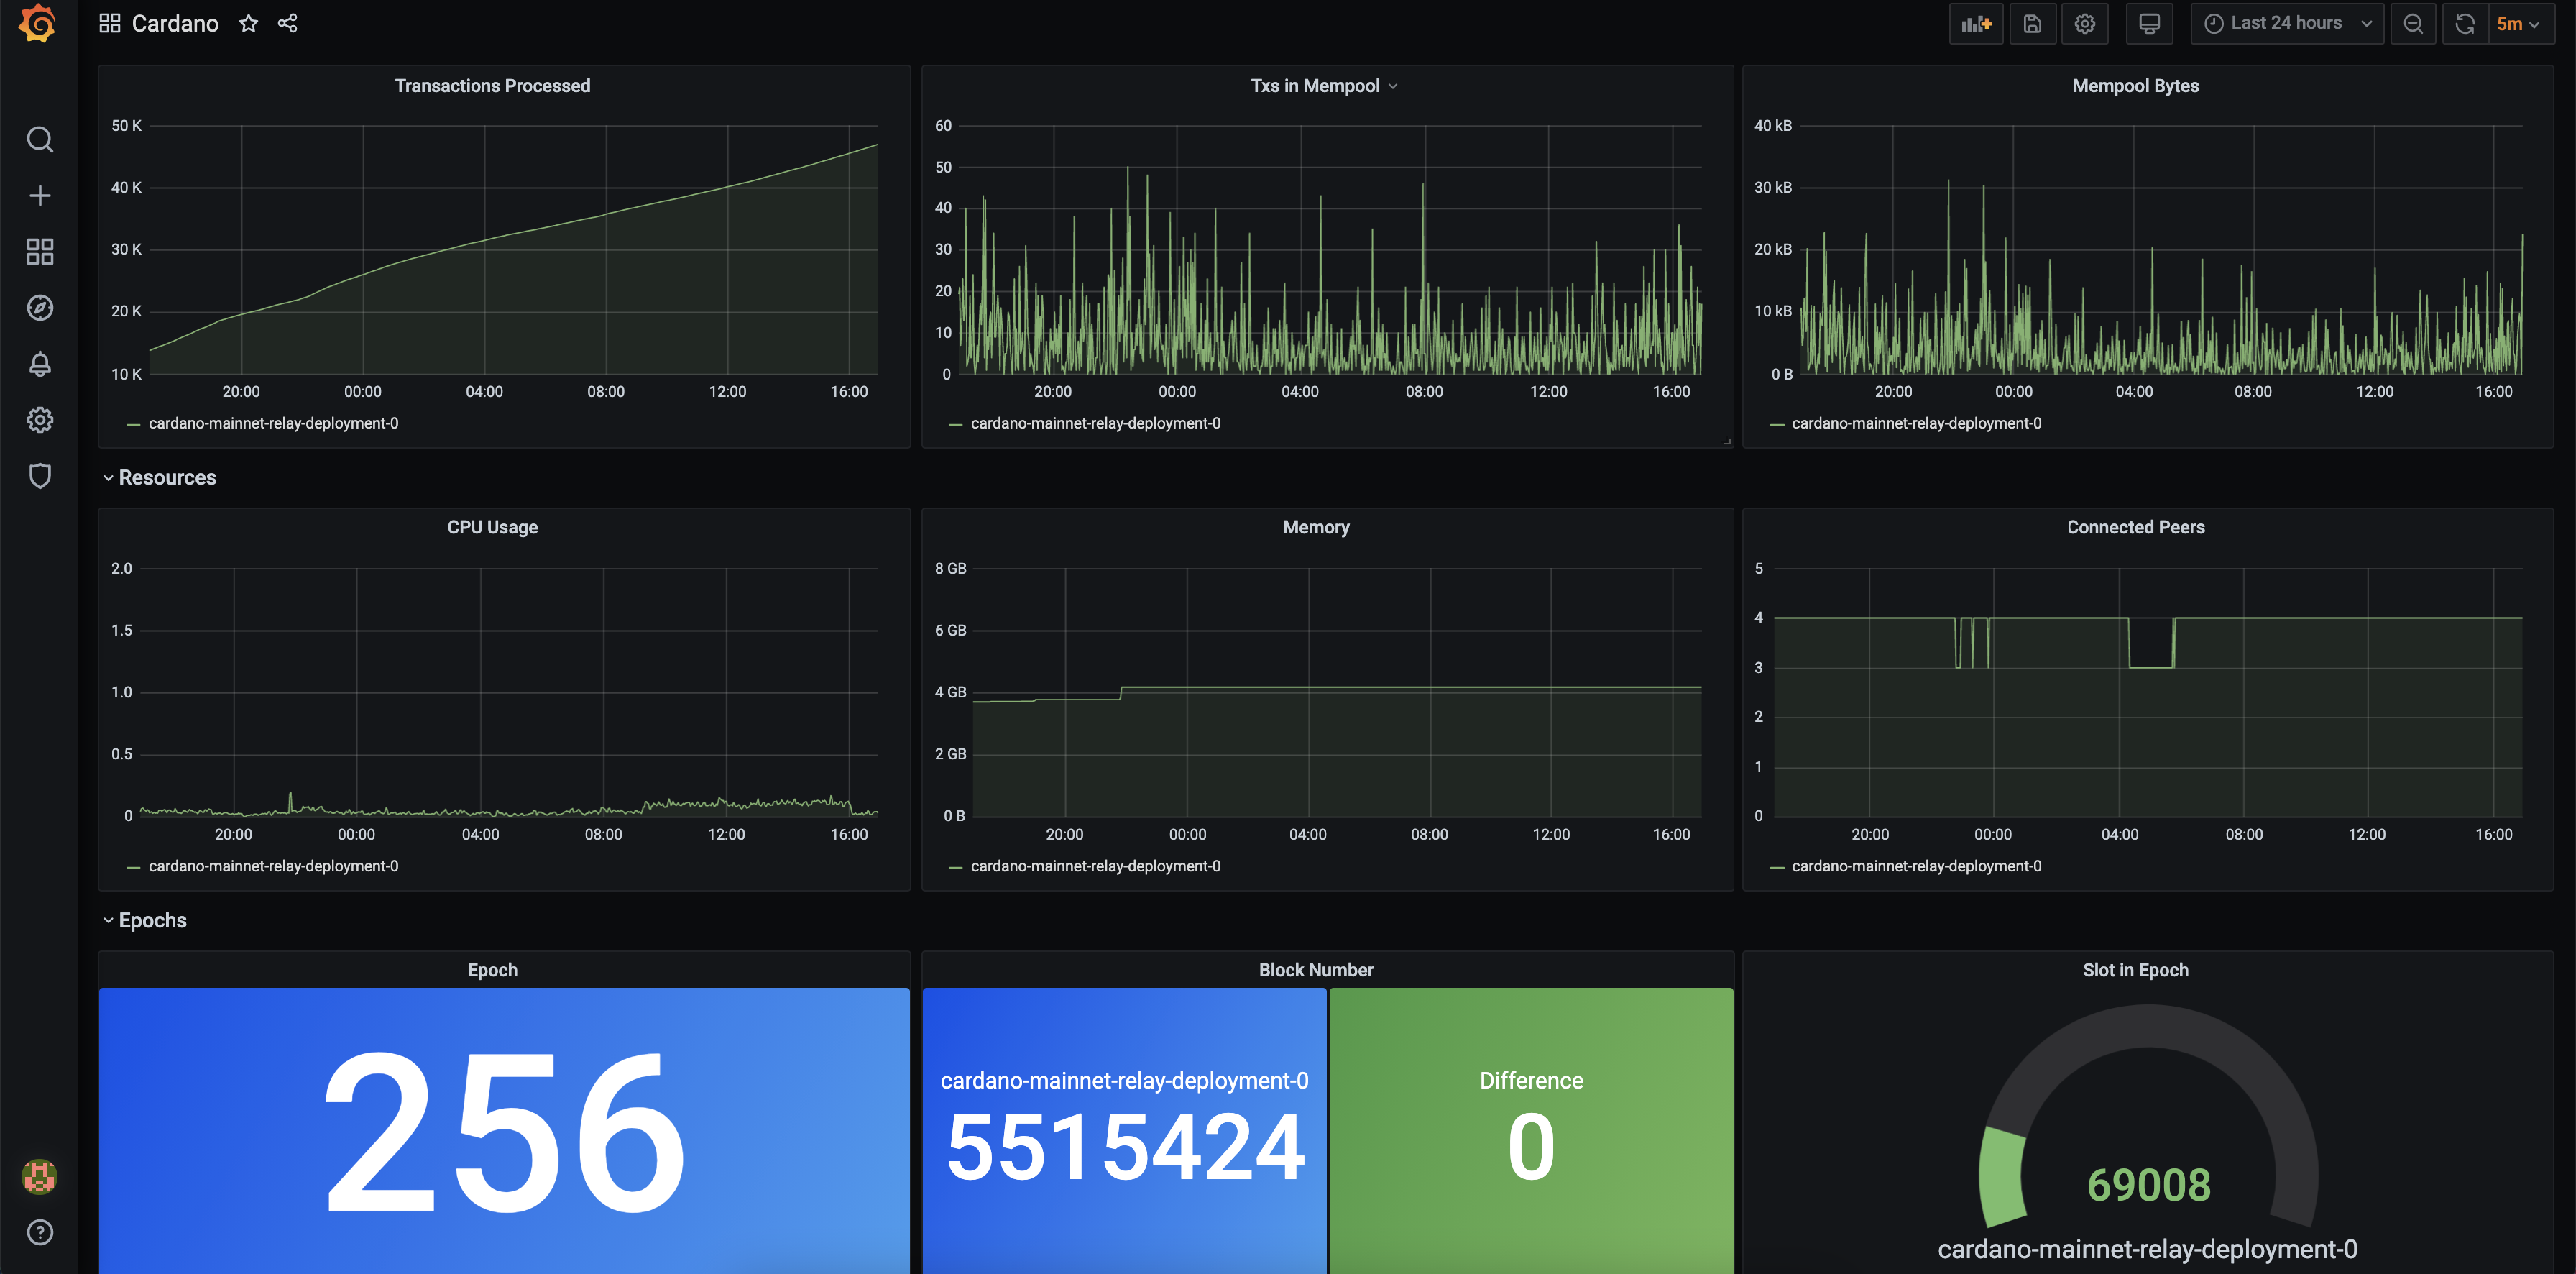
Each metric includes the pod it was scraped from, so you can use `` in the Legend field to show nice pod names for each set of data.
If you find this post useful or are looking for somewhere to delegate while setting up your own pool, check out my pool [CODER]! 😀